


Difference between revisions of "File:Euler phi trend 50000.png"
(Graph of how strong the lines are in Image:Euler_totient_50000) |
(→Summary) |
||
| Line 1: | Line 1: | ||
== Summary == | == Summary == | ||
| − | Graph of how strong the lines are in [[Image:Euler_totient_50000]] | + | Graph of how strong the lines are in [[Image:Euler_totient_50000.png]] |
Latest revision as of 14:52, 27 July 2024
Summary
Graph of how strong the lines are in 
File history
Click on a date/time to view the file as it appeared at that time.
| Date/Time | Thumbnail | Dimensions | User | Comment | |
|---|---|---|---|---|---|
| current | 14:52, 27 July 2024 | 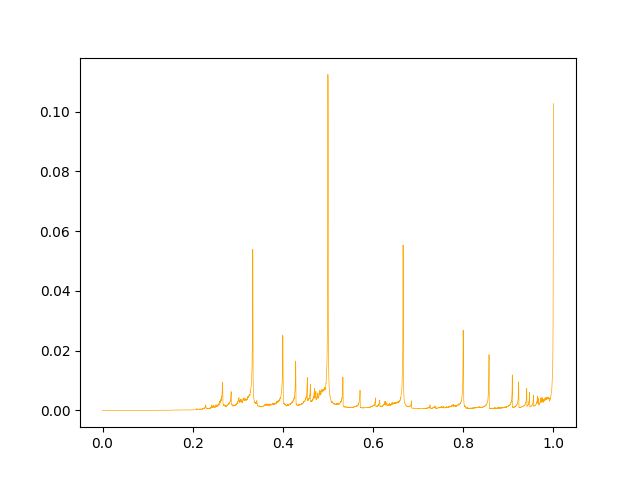 | 640 × 480 (17 KB) | Afly (talk | contribs) | Graph of how strong the lines are in Image:Euler_totient_50000 |
- You cannot overwrite this file.
File usage
There are no pages that link to this file.


