Asymptote: Useful commands and their Output
For each of the following, we have put a blue dot at the origin in order to indicate relative location of the output on the coordinate plane. In other words, assume that before each of the examples below is the command
dot((0,0),blue);
In addition, a comment after a line such as //math - extension indicates that the command (in this case extension) used in that line is defined in the math package, thus motivating the include math; (or other appropriate package) line at the top of the example.
Example 1:
dot((20,0));
Example 2:
draw((0,0)--(50,0),BeginArrow);
draw((0,-10)--(50,-10),MidArrow);
draw((0,-30)--(50,-30),Arrows);
Example 3:
draw((0,0)--(50,0));
arrow((30,0),dir(180),green);
Example 4:
include math;
pair A,B,C,D,E;
A=(0,0); C=(50,0); B=(10,10); D=(40,20);
E=extension(A,B,C,D);  // math - extension
// extension(A,B,C,D) returns the intersection of lines AB and CD
draw(A--B); draw(C--D);
draw(B--E--D,orange);
Example 5:
include graph;
draw(Circle((0,0),20)); // graph - Circle
Example 6:
path p=(0,0)..(20,15)..(40,-5)..(50,0);
draw(p);
draw(rotate(90)*p,green);
draw(rotate(180,(-5,0))*p,orange);
draw(shift((5,20))*p,magenta);
draw(shift((0,-25))*yscale(1.4)*p,red);
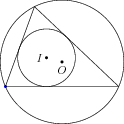
Example 7:
include olympiad;
pair A,B,C,O,I;
A=origin; B=2*right; C=1.5*dir(70);
O=circumcenter(A,B,C); // olympiad - circumcenter
I=incenter(A,B,C); // olympiad - incenter
draw(A--B--C--cycle);
dot(O);
dot(I);
draw(circumcircle(A,B,C)); // olympiad - circumcircle
draw(incircle(A,B,C)); // olympiad - incircle
label(" ",I,W);
label("
 ",O,S);
Example 8:
include three;
unitsize(1inch);
currentprojection=orthographic(1/2,-1,1/2); // three - currentprojection, orthographic
draw((0,0,0)--(1,0,0)--(1,1,0)--(0,1,0)--cycle3,red); //three - cycle3
draw((0,0,0)--(0,0,1));
draw((0,1,0)--(0,1,1));
draw((1,1,0)--(1,1,1));
draw((1,0,0)--(1,0,1));
draw((0,0,1)--(1,0,1)--(1,1,1)--(0,1,1)--cycle3,green);


